
Case studies / eCommerce
Alcohol ecommerce · Google & MetaThe best month cost the least.
OMG Cheers sells alcohol gifting online, a restricted category on both platforms before a single ad runs. Once approved, the account spent 29% less in December than in September and produced almost the same revenue. Cost per order halved over seven months.
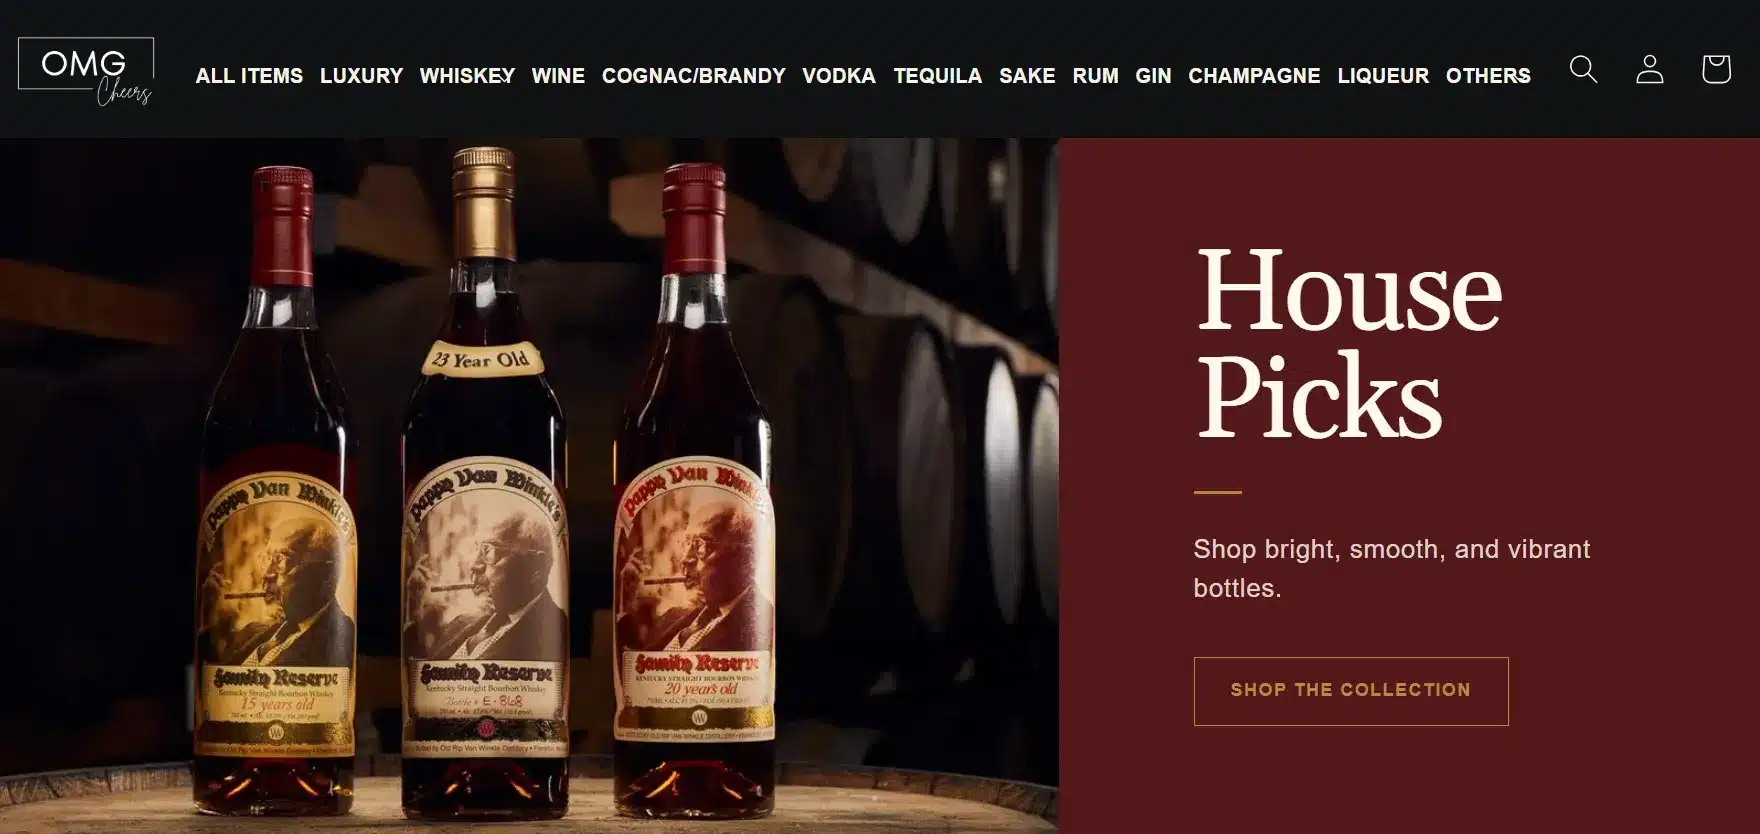
An alcohol gifting brand, restricted before a single ad runs.
OMG Cheers sells alcohol gift sets and curated beverage gifting online, with good product and clear occasion-driven demand.
Alcohol is a restricted category on Google and Meta, subject to certification, age-gating and state-by-state targeting rules that apply before performance is even a question, and getting the catalogue approved was the first piece of work.
Peak season is when most accounts spend the most and learn the least.
The standard gifting playbook is to hold budget for Q4 and pour it in. It works, in the sense that revenue arrives, but the account is buying at the most competitive moment of the year with whatever structure it happened to have in August. The alternative is to spend the quiet months making the account efficient, then arrive at December needing less money to do the same work.
The biggest budget month.
Google spend reached its highest point of the period. Revenue followed, and on a spend chart this looks like the account working exactly as intended: more in, more out.
- Spend $8,430
- Sales $38,978
- Cost per order $16.31
- ROAS 4.62x
29% less money. Almost the same revenue.
By the busiest month of the year, the account needed substantially less budget to produce comparable sales. Spend fell by more than a quarter, revenue by six percent, and cost per order dropped to under twelve dollars.
- Spend $5,985
- Sales $36,491
- Cost per order $11.82
- ROAS 6.09x
Alcohol is restricted before you write a single ad.
OMG Cheers sells alcohol gift sets and curated beverage gifting online. Good product, clear occasion-driven demand, and a category where most of the standard ecommerce playbook is unavailable.
Four constraints, starting with whether the products could appear at all.
-
Shopping approval is the gate
Alcohol is a restricted category on Google and Meta. Certification requirements, age-gating, and state-by-state restrictions on where ads can serve all apply before performance is even a question. Getting the catalogue approved for Google Shopping was the first piece of work, and without it nothing else was possible.
-
Gifting demand is concentrated
A gifting brand doesn't get twelve months to optimise. It gets a handful of occasions, and the largest one arrives in December. Whatever the account has learned by November is what it takes into the only month that really matters.
-
Two platforms, two different buyers
Search and social attract different purchase behaviour in gifting, and treating them as interchangeable means optimising both toward the wrong thing.
-
Returns were rising with revenue
Not a marketing problem, and one that materially affects what the revenue figures actually mean. It needed to be visible in the reporting rather than left out of it.
Five steps, and December was the deadline.
Everything before Q4 was preparation for it.
Get the alcohol catalogue approved
Google Shopping approval for alcohol requires meeting certification and targeting requirements, and getting product data and landing pages aligned with a policy that permits far less than an unrestricted category. This is where alcohol brands most often stall, and it had to be cleared before any performance work began.
Products eligible to serve on Shopping.
Build Google around intent, Meta around discovery
Search and Shopping on Google for people already looking for a gift, Meta for people who hadn't thought of one yet. The data justified the split: Google's average order value settled around $74, Meta's around $106. Different buyers, different basket, different creative.
42% higher order value from Meta than Google.
Use the quiet months to buy efficiency
June through September was the testing window, structure, bidding, creative and audience work done while the auction was cheap and mistakes were affordable. Cost per order on Google fell from $24.71 to $16.31 across that period, before peak season began.
An account that arrived at Q4 already optimised.
Add email and SMS as owned channels
Automated email and SMS flows built alongside the paid programme, capturing leads paid media generated and converting them without additional media cost. This revenue is deliberately excluded from the ROAS figures on this page, because folding a channel with no media cost into a paid ratio inflates it.
Revenue from traffic already paid for once.
Hold spend down through peak
Rather than scaling budget into the most expensive auction of the year, we let the efficiency gains carry December. Google spend came in below September's while producing comparable revenue, and Meta hit its strongest month of the period at 6.31x.
Best-performing month on both platforms, at reduced spend.
Both platforms, seven months.
-
Google Ads$44,303 spend · $201,043 sales · 2,706 orders · $74.30 AOV4.54x ROAS
-
Meta Ads$24,332 spend · $120,662 sales · 1,142 orders · $105.66 AOV4.96x ROAS
-
Combined$68,635 spend · $321,705 sales · 3,848 orders4.69x ROAS
Google ROAS climbed from 2.90 to 6.09 across the period. Meta from 3.81 to 6.31. Cost per order fell by roughly half on both.
And the part we put in the client's report
Returns across the period totalled $62,358, around 19% of ad-attributed sales. December alone accounted for $18,480, the highest month by a wide margin and rising faster than revenue.
Our own performance report to the client read: "Returns have increased with sales. The team needs to fix the returns issue urgently." It's not a marketing problem and it isn't within our scope. It also materially changes what the revenue figures mean.
Returns in that dataset are total store returns rather than ad-specific, so they can't be attributed cleanly to paid channels. But an agency reporting ROAS while a fifth of revenue comes back through the door is describing half a picture, and the client is the one who has to plan against the other half.
Reported ROAS is a gross number in every ecommerce account. Fulfilment costs, margins and returns all sit between it and the money the business keeps. Any agency that never mentions that is showing you the flattering end of the calculation.
Four things worth taking from this.
Buy efficiency in the quiet months
Testing in a cheap auction costs less than testing in an expensive one. If your revenue concentrates in Q4, the work that makes Q4 profitable happens in July.
Check whether email is inside your ROAS
Email and SMS carry no media cost. Folding that revenue into a paid ratio inflates it, sometimes dramatically. Ask your agency what's in the numerator.
Platforms attract different baskets
Order value here ran 42% higher on Meta than Google. If you optimise both toward the same target, you're underweighting whichever one brings the bigger orders.
Track returns against ad revenue
A rising return rate quietly cancels a rising ROAS. If your reporting shows one and not the other, you're making budget decisions on an incomplete number.
What went into it.
Seven of our services, on one account.
Other restricted-category work.
Do you know what's actually in your ROAS?
Email revenue in the numerator, returns left out of the denominator, and a number that looks better than the bank account. Give us read-only access to your ad accounts and store data and we'll show you the paid-only figure, net of returns. Findings are yours to keep either way.
Read-only access · No obligation · You keep your accounts